Infographics Skeletons
By Erika Goering,
Filed under: KCAI, VisCom2
Comments: Comments Off on Infographics Skeletons
Finally putting information with my pictograms.
I had a pretty good idea of what my pictograms could represent, so I didn’t have too much trouble putting them into context with the information/data that I have.
This is the framework I’ve got so far for my infographics. Ta-da!
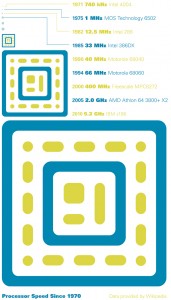
Issues: Smaller CPUs are too dang tiny. So I’m either going to do a call-out, zoom-in type of thing that makes them easier to see, or I’ll simplify my icons even more (only at the smaller sizes) so they’re easier to read when they’re super-small.
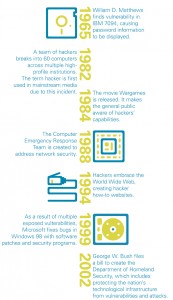
The timeline’s dates should be spaced out in proportion to the timespan that they represent. For example, all the 1980s dates will be closer to each other than to 1965. Also, I’ll be using the timeline’s “spine” differently, whether that be a solid line or something else. I’ll play around with it and see what works the best.
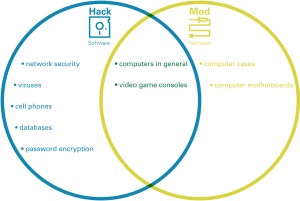
My Venn diagram needs the labeling outside of the circles. And a suggestion from my critique partner was to use the shapes in the icons themselves as the frame for the diagram. Ooh! Fancy!
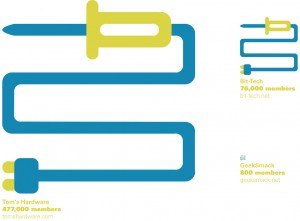
The ethernet idea is solid, but the information is so low-contrast in comparison with the white background… I need to make it darker. And the ethernet plug should be smaller. As close to actual size as possible. Boo-yah! And same thing with spacing out the dates according to relation to each other in time. Gonna fix that too.
Soldering iron cords should grow longer (instead of whole icon growing larger) to reflect the number of members in each online community. Shorter cord = fewer members. Yep. Simple as that.
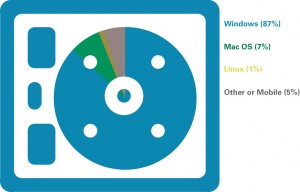
Hard drive pie chart has some problems. First of all, my data is referring to the overall usage share among average people. It should reference the l33t crowd specifically, which would have a much higher number of Linux users (and make for a nicer-looking graph!). So, the first thing would be to find a good statistic for hacker/modder operating systems. Yeah, Windows will still prevail (as lots of hacker-types are also PC gamers), but I want the information to be more relevant to my specific culture. (Hackers love their Linux, don’tcha know?)
As for the color in the pie chart, that will definitely change. This rough “skeleton” of visual data is admittedly sloppy. I didn’t have time to cut out each little piece of negative space, so I just set the blending mode to “overlay” or something similar, and that changed the color from what I had in mind. It will be fixed soon. Although, the overall color (especially the green) will change a bit, anyway. So none of this is set in stone at the moment.
Next step is to pick the ones that work well at communicating, and explore those options like crazy.
Wish me luck!
